
Website sections:
Current section's content:
- About the Services Provided
- Overview of the Services Provided
- Objectives and Work History
- Additionally About Myself
- Build a Sustainable Software Application Infrastructure Cost Effectively Around Software Development Talent
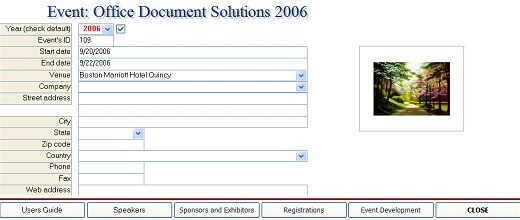
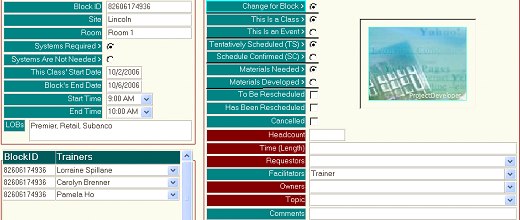
- From Task Management to Advanced Process Management Applications
- What Do We Want to Achieve with Management Reporting?
- Preferred Project Development Principles
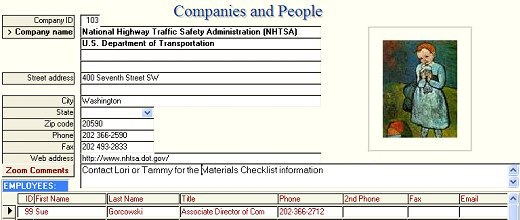
- Custom Developed Workflow Software and Business Process Software
- Database Application Development Principles
- How Much Customization Is the Right Amount?
- Custom Software Development Process in a Nutshell
- Cost Effective Software
- My Billing and Charging Ethics Handbook

What Do We Want to Achieve with Management Reporting?
In order to make management reporting an operationally useful tool, just like in software development areas, one of the main questions to ask is: What do we want to achieve here?
In management reporting areas, I have good solutions to offer, when management reporting is used for setting and achieving manageable operational objectives and goals.
For the sake of clarity, I will add that I define objective as an overall aim or project development direction. Objectives are general descriptions and may be subject to interpretations. Project's goals should reflect what the person or persons who are responsible for the project's development and management intend to achieve with the project. Compared to objectives goals should be specific, actionable and, preferably, measurable.
Following broadly defined steps can be helpful when management reporting is used for setting and achieving manageable operational objectives and goals.
- Define the operational activity and task areas that affect the outcome. What units (departments, workgroups, and so on) and what actions affect the outcome?
- For each operational activity and task area define the objectives and goals, and get participants buy-in.
- Define the metrics that should be used and actually support the operational activity and task area objectives and goals. For example, if the goal is to have 0% of defects, then average or median number of defects is not right metric, the percentage is.
- Make sure that the operational objectives and goals are actually manageable. External factors that the participants cannot manage, but affect the operational outcomes, can be part of the report. Perhaps such factors can be forecasted, or, if other parties (other companies or divisions) manage these factors, perhaps it is possible to set up collaborative objectives and goals in a manner similar to the above, and report on how well these objectives and goals are being achieved.
- For reporting purposes, use easy to understand and digest graphical solutions (PowerPoint, for example), accompanied with concise explanatory text. People who see the report without any personal explanations should also be able to understand what each slide in the report is about and is trying to communicate.
- Graphical solutions that look visually engaging and are also understandable, are more likely to get the viewers attention than are dull-looking ones, especially, if their purpose and message are unclear.
- If you need to use complicated sets of data in the report, start the report with easy to understand and digest graphical solutions, and then build from there toward more complex data sets.
- As needed, provide support data separately in a searchable format. For data, use workbooks and spreadsheets, not PDFs.